
Survey Results – Assisted Service Operations (2020/2021)
Question 1: How did your Q1 2020 passenger traffic compare to Q1 2019? (Figure 1):
Upon comparison of 2019 PRM traffic rates with 2020 it comes as no surprise traffic is down. Responding airports reported rates of 50% and providers 63% globally. When accounting for all business types (airlines, authorities…) the averaged traffic rates sit at 53% in Q1 2020. Airports serving 50,001 – 149,000 assisted passengers annually in 2019 identified the least change with rates achieving 72% of 2019 Q1 numbers. Smaller airports (<25,000 PRM passengers in 2019) responded with a traffic drop of 80%, reaching only 20% of 2019 Q1 rates. Service providers experienced an averaged 67% of traffic in Q1 2020. Further examination of Q1 traffic rates reveals a 57% majority of all survey respondents achieved 51%-100% of traffic. 55% of airports responded 10-50% and 45% 51-100%. Service providers were unanimous in their responses, all replying with 50%+ traffic.
Question 2: How did your Q2 2020 passenger traffic compare to Q2 2019?
Q2 was, for most, a quarter significantly impacted, the epicenter of the pandemic had reached Europe and everyone within the industry had entered unprecedented times. PRM traffic numbers in Q2 2020 vs Q2 2019 witnessed a dramatic change. Across all organisation types who responded the averaged PRM rate had dropped to 10%. Responding airports experienced a 90% drop from 2019 and 43% from Q1 with only 18% of participants reporting greater than 10% traffic. Provider responses mirrored airports with 10% traffic, only 12% responding with greater than 10 percent traffic.
Question 3: How did your Q3 2020 passenger traffic compare to Q3 2019? (Figure 2):
23% of PRM traffic had emerged in Q3 2020 – a previous Ozion Insights report had identified the PRM penetration rates surpassing other passenger groups and responses in the survey indicate a similar story. Q3 traffic 2020 had grown by 10% from the previous quarter – reaching 20%. Participating airports witnessed an averaged 23% and providers 21%. Those who had entered national lockdowns earlier (typically certain geographic locations) experienced significant increase in the third quarter, reaching as high as 70% of PRM traffic compared to the previous year. However, 91% of participating airports remained below 50% of 2019 traffic.
Question 4: How do you expect Q4 2020 to perform against Q4 2019?
Q4 expectations remained conservative. Overall, participants anticipated an average 22% traffic rate. Airports anticipating 24%, a slightly more optimistic outlook compared to provider’s 23%.
In summary…
2020 survey responses indicate that providers had a slower reaction to COVID-19. As the industry essentially came to a standstill in Q2 all organisation types experienced a significant drop to 10% of traffic. Q3 saw airports achieve slightly more positive rates than providers (+2%), a tiny margin which was anticipated to be kept thru Q4.
Question 5: What PRM traffic expectations do you have for 2121?
The global survey responses reveal stakeholder expectations of passenger traffic return. Across all organisation types the average PRM traffic rate expectations for 2021 (vs 2019) is 42%. Airports expect 43% over the period versus 44% by providers.
Question 6: How long do you expect for a total recovery?
39% of respondents anticipate a duration of 3 years until total passenger traffic resumes. 44% anticipate a shorter timeframe of 2 years. 54% of participating airports shared an expectation of 3 years, versus 36% who anticipate a two-year recovery. Providers seem to be in less agreement whereby 25% envision a 4-year recovery period.
Question 7: What volume of staff reductions has your organisation endured in 2020? (Figure 5):
Survey participants across all organisation types reported an average 11% of staff who had been repurposed in 2020. Airports declared a 25% re-purposing level compared to 9% with service providers.
Question 8: What volume of staff reductions is your organisation anticipating in 2021? (Figure 6):
The expected reduction rate is 24%. Airports anticipate an averaged 25% while providers anticipate slightly more redundancies at 28%. Others, including airlines and authorities, estimate a further 15%.
Question 9: What volume of staff have been repurposed during 2020? (Figure 7):
Survey participants across all organisation types reported an averaged an 11% of staff had been repurposed in 2020. Airports declared a 25% repurposing level compared to 9% at service providers. Question 10: Do you have a long-term strategy to reinstate staff? (Figure 8): 38% of service providers possess a long-term plan to reinstate staff compared to airports (30%). 60% of participating airport stakeholders are unsure whether a long-term plan was established with only 10% stating a definitive plan to not reinstate. At 80%, other participants, including airlines and authorities, expressed a clear intent to reinstate staff.
The full survey results can be downloaded here for free. The remaining questions include:
Question 10: Do you have a long-term strategy to reinstate staff?
Question 11: How have your passenger ratings changed in 2020?
Question 12: Were contractual agreements/ SLAs adjusted during this period?
Question 13: Have there been any significant structural changes to the service as a result of the pandemic?
Question 14: Are there plans to make significant changes to your PRM operation?
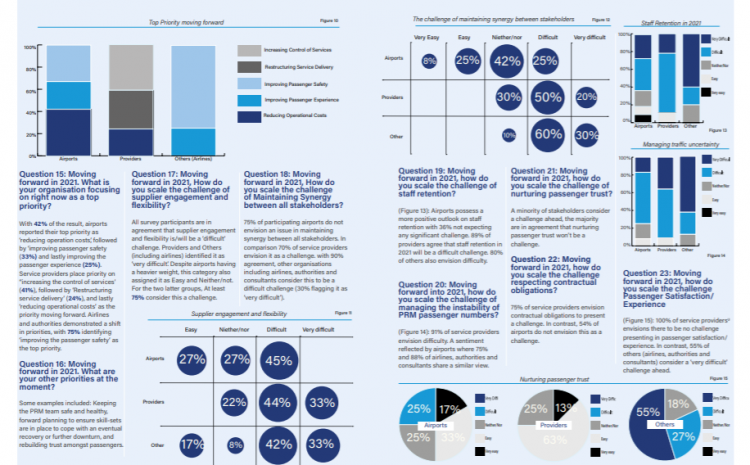
Question 15: Moving forward in 2021. What is your organisation focusing on right now as a top priority?
Question 16: Moving forward in 2021. What are your other priorities at the moment?
Question 17: Moving forward in 2021, How do you scale the challenge of supplier engagement and flexibility?
Question 18: Moving forward in 2021, How do you scale the challenge of Maintaining Synergy between stakeholders?
Question 19: Moving forward in 2021, how do you scale the challenge of staff retention in 2021?
Question 20: Moving forward in 2021, how do you scale the challenge of unstable passenger numbers?
Question 21: Moving forward in 2021, how do you scale the challenge of nurturing passenger trust?
Question 22: Moving forward in 2021, how do you scale the challenge respecting contractual obligations?
Question 23: Moving forward in 2021, how do you scale the challenge Passenger Satisfaction/Experience?