Description
A comparative study on No-Show arrival rates across 5 European airports of moderate traffic sizes. Comparing and detecting a shift in No-Show trends from 2019 to 2020 the COVID-19 Pandemic influences passenger behaviour.


Free Download!
The repercussions of COVID-19 span across all PRM metrics. For better or worse, Industry stakeholders are better positioned to adapt operational services if presented
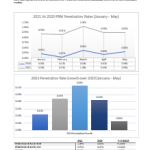
with current and trending data. This report investigates the NoShow on arrival trends among 5 European Airports. A previously published No-Show on Arrival Analysis Report examined, in depth, the 2019 No Show rates. This report presents a comparison among a smaller dataset of 5 airports of moderate traffic volumes ranging from
(50,000 to 400,000 PRMs).
The 2019 no-show rates among the airports sampled demonstrate stability, averaging 14.40% throughout the year. January demonstrated the lowest no-show rate at 14.35% whilst August witnessed a peak at 18.30% (+3.95%).
Download to read full report.
A comparative study on No-Show arrival rates across 5 European airports of moderate traffic sizes. Comparing and detecting a shift in No-Show trends from 2019 to 2020 the COVID-19 Pandemic influences passenger behaviour.